Tutorial 8: Horizontal Integration

Import necessary packages
from sklearn import metrics
import torch
import copy
import os
import random
import numpy as np
from semanticst.loading_batches import PrepareDataloader
from semanticst.loading_batches import Dataloader
import scanpy as sc
import matplotlib.pyplot as plt
import pandas as pd
from pathlib import Path
import torch.utils.data as data
from semanticst.main import Config
/home/roxana/anaconda3/envs/semanticst3/lib/python3.9/site-packages/torch/__config__.py:10: UserWarning: CUDA initialization: The NVIDIA driver on your system is too old (found version 11040). Please update your GPU driver by downloading and installing a new version from the URL: http://www.nvidia.com/Download/index.aspx Alternatively, go to: https://pytorch.org to install a PyTorch version that has been compiled with your version of the CUDA driver. (Triggered internally at ../c10/cuda/CUDAFunctions.cpp:108.)
  return torch._C._show_config()
Read data
##########33Reading two datasets
file_path='/home/roxana/Projects/Data/Mouse_brain-20241014T232630Z-001/Mouse_brain/'
adata1=sc.read(file_path+"MA1.h5ad")
adata2=sc.read(file_path+"MP1.h5ad")
/home/roxana/anaconda3/envs/semanticst3/lib/python3.9/site-packages/anndata/_core/anndata.py:1756: UserWarning: Variable names are not unique. To make them unique, call `.var_names_make_unique`.
  utils.warn_names_duplicates("var")
/home/roxana/anaconda3/envs/semanticst3/lib/python3.9/site-packages/anndata/_core/anndata.py:1756: UserWarning: Variable names are not unique. To make them unique, call `.var_names_make_unique`.
  utils.warn_names_duplicates("var")
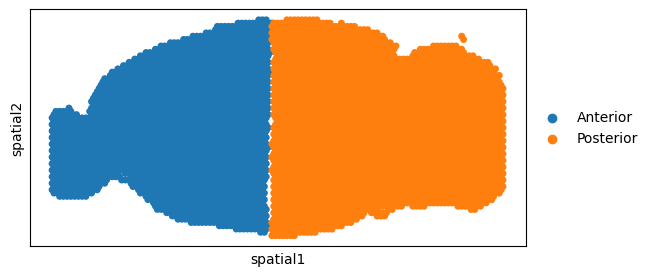
Horizontal spatial alignment
x_pixel1 = adata1.obs["x4"].values
y_pixel1 = adata1.obs["x5"].values

# Combine x and y into a (n_samples, 2) array for adata1
spatial_coords1 = np.column_stack((y_pixel1,x_pixel1))

# Assign to adata1.obsm['spatial']
adata1.obsm['spatial'] = spatial_coords1

# Get x and y coordinates for adata2
x_pixel2 = adata2.obs["x4"].values
y_pixel2 = adata2.obs["x5"].values

# Adjust the coordinates for adata2 to align horizontally with adata1
x_pixel2_adjusted = x_pixel2-np.min(x_pixel2)+np.min(x_pixel1)
y_pixel2_adjusted = y_pixel2-np.min(y_pixel2)+np.max(y_pixel1)
# Combine adjusted x and y into a (n_samples, 2) array for adata2
spatial_coords2 = np.column_stack((y_pixel2_adjusted,x_pixel2_adjusted ))

# Assign to adata2.obsm['spatial']
adata2.obsm['spatial'] = spatial_coords2
from anndata import AnnData
adata1.var_names_make_unique()
adata2.var_names_make_unique()
adata1.obs["x_pixel"]=x_pixel1
adata1.obs["y_pixel"]=y_pixel1
adata2.obs["x_pixel"]=x_pixel2-np.min(x_pixel2)+np.min(x_pixel1)
adata2.obs["y_pixel"]=y_pixel2-np.min(y_pixel2)+np.max(y_pixel1)
adata_all=AnnData.concatenate(adata1, adata2,join='inner',batch_key="dataset_batch",batch_categories=["Anterior","Posterior"])
/tmp/ipykernel_135475/3942843071.py:8: FutureWarning: Use anndata.concat instead of AnnData.concatenate, AnnData.concatenate is deprecated and will be removed in the future. See the tutorial for concat at: https://anndata.readthedocs.io/en/latest/concatenation.html
  adata_all=AnnData.concatenate(adata1, adata2,join='inner',batch_key="dataset_batch",batch_categories=["Anterior","Posterior"])
ax = sc.pl.embedding(adata_all, basis='spatial',
                color='dataset_batch',title='',size=100,
                show=False)
ax.set_aspect('equal', 'box')

ax.axes.invert_yaxis()
#plt.savefig("Aligned_mouse_AP_int.png", dpi=600)
device = torch.device('cuda:1' if torch.cuda.is_available() else 'cpu')
print(f"You are using *{device}*")
adata_all.var_names_make_unique()
sc.pp.filter_cells(adata_all, min_genes=20)
sc.pp.filter_genes(adata_all, min_cells=50)
Train the model
dtype = "Visium"  # Change to "h5ad" if necessary
config=Config(device=device,dtype=dtype, use_mini_batch=False)
from semanticst.SemanticST_main import Semantic as Trainer
config_used = copy.copy(config)
model = Trainer(adata_all,config)
adata_all=model.train()  # Train the model
🚀 Welcome to SemanticST! 🚀

📢 Recommendation: If your dataset contains more than 40000 spots or cells, we suggest using **mini-batch training** for efficiency.

✅ Using Full Dataset Training (No Mini-Batching). 🔥
/home/roxana/anaconda3/envs/semanticst3/lib/python3.9/site-packages/numba/np/ufunc/parallel.py:371: NumbaWarning: The TBB threading layer requires TBB version 2021 update 6 or later i.e., TBB_INTERFACE_VERSION >= 12060. Found TBB_INTERFACE_VERSION = 12050. The TBB threading layer is disabled.
  warnings.warn(problem)
Begin to train ST data...
Learning Semantic graphs: 100%|████████████████████████████████████████████████████████████████████████████████████████████████████████████████████████████████████████| 250/250 [00:15<00:00, 16.21epoch/s]
Semantic Graph Learning Completed
Feature Learning Epochs: 100%|██████████████████████████████████████████████████████████████████████████████████████████████████████████████████████████████████████████| 1000/1000 [09:09<00:00, 1.82it/s]
Clustering
# clustering

n_cluster=24
tool = 'mclust' # mclust, leiden, and louvain

# clustering
from semanticst.utils import clustering
clustering(adata_all,seed=41, n_clusters=n_cluster, method=tool,key='emb_decoder')
fitting ...
  |======================================================================| 100%
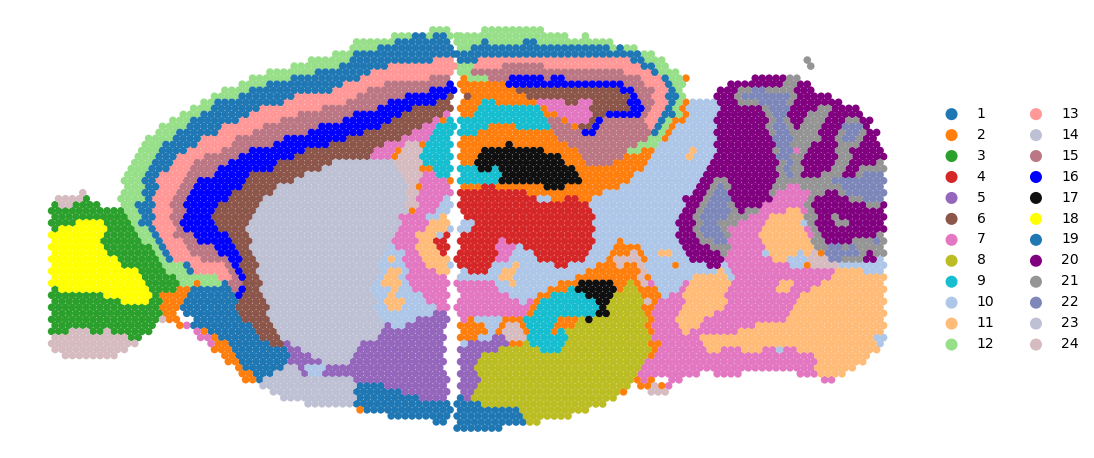
# plotting spatial clustering result
import matplotlib.pyplot as plt
import seaborn as sns
colors_use=['#1f77b4', '#ff7f0e', '#2ca02c', '#d62728', '#9467bd', '#8c564b', '#e377c2', '#bcbd22', '#17becf', '#aec7e8', '#ffbb78', '#98df8a', '#ff9896', '#bec1d4', '#bb7784', '#0000ff', '#111010', '#FFFF00',   '#1f77b4', '#800080', '#959595',
 '#7d87b9', '#bec1d4', '#d6bcc0', '#bb7784', '#8e063b', '#4a6fe3', '#8595e1', '#b5bbe3', '#e6afb9', '#e07b91', '#d33f6a', '#11c638', '#8dd593', '#c6dec7', '#ead3c6', '#f0b98d', '#ef9708', '#0fcfc0', '#9cded6', '#d5eae7', '#f3e1eb', '#f6c4e1', '#f79cd4']
adata_all.obsm['spatial'][:,1] = -1*adata_all.obsm['spatial'][:,1]
rgb_values = sns.color_palette("tab20", len(adata_all.obs['domain'].unique()))
color_fine = dict(zip(list(adata_all.obs['domain'].unique()), rgb_values))

plt.rcParams["figure.figsize"] = (12, 6)
sc.pl.embedding(adata_all, basis="spatial",
                color="domain",
                s=100,
                palette=colors_use,
                show=False,
                title='')
plt.axis('off')
#plt.savefig("SemanticST_int_h_mclust.png", dpi=600,bbox_inches='tight')
plt.show()

adata_all.obs["x_pixel"]=adata_all.obs["x_pixel"]
adata_all.obs["y_pixel"]=adata_all.obs["y_pixel"]
colors_use=['#1f77b4', '#ff7f0e', '#2ca02c', '#d62728', '#9467bd', '#8c564b', '#e377c2', '#bcbd22', '#17becf', '#aec7e8', '#ffbb78', '#98df8a', '#ff9896', '#bec1d4', '#bb7784', '#0000ff', '#111010', '#FFFF00',   '#1f77b4', '#800080', '#959595',
 '#7d87b9', '#bec1d4', '#d6bcc0', '#bb7784', '#8e063b', '#4a6fe3', '#8595e1', '#b5bbe3', '#e6afb9', '#e07b91', '#d33f6a', '#11c638', '#8dd593', '#c6dec7', '#ead3c6', '#f0b98d', '#ef9708', '#0fcfc0', '#9cded6', '#d5eae7', '#f3e1eb', '#f6c4e1', '#f79cd4']
num_celltype=len(adata_all.obs["domain"].unique())
adata.uns["pred_colors"]=list(colors_use[:num_celltype])
ax=sc.pl.scatter(adata_all,alpha=1,x="y_pixel",y="x_pixel",color="domain",palette=colors_use,show=False,title='',size=120)
ax.set_aspect('equal', 'box')
ax.axis('off')
ax.axes.invert_yaxis()
#plt.savefig("SemanticST_mouse_AP_int.png", dpi=600)
#plt.close()