Tutorial 6: Human Breast Cancer Analysis (10X Visium)
This tutorial demonstrates how to use SemanticST to identify spatial domains in Visium data from human breast cancer.
Import necessary packages
from sklearn import metrics
import torch
import copy
import os
import random
import numpy as np
from semanticst.loading_batches import PrepareDataloader
from semanticst.loading_batches import Dataloader
import scanpy as sc
import matplotlib.pyplot as plt
import pandas as pd
from pathlib import Path
import torch.utils.data as data
from semanticst.main import Config
/home/roxana/anaconda3/envs/semanticst3/lib/python3.9/site-packages/torch/__config__.py:10: UserWarning: CUDA initialization: The NVIDIA driver on your system is too old (found version 11040). Please update your GPU driver by downloading and installing a new version from the URL: http://www.nvidia.com/Download/index.aspx Alternatively, go to: https://pytorch.org to install a PyTorch version that has been compiled with your version of the CUDA driver. (Triggered internally at ../c10/cuda/CUDAFunctions.cpp:108.)
  return torch._C._show_config()
Read data and import device
device = torch.device('cuda:0' if torch.cuda.is_available() else 'cpu')
print(f"You are using *{device}*")
BASE_PATH = Path('/home/roxana/Projects/Data/3.Human_Breast_Cancer/')
spot_paths= Path(f'{BASE_PATH}')
dataset="Breast Cancer"
adata = sc.read_visium(spot_paths)
adata.var_names_make_unique()
#sc.pp.filter_cells(adata, min_genes=20)
#sc.pp.filter_genes(adata, min_cells=50)
print(adata)
/home/roxana/anaconda3/envs/semanticst3/lib/python3.9/site-packages/anndata/_core/anndata.py:1756: UserWarning: Variable names are not unique. To make them unique, call `.var_names_make_unique`.
  utils.warn_names_duplicates("var")
/home/roxana/anaconda3/envs/semanticst3/lib/python3.9/site-packages/anndata/_core/anndata.py:1756: UserWarning: Variable names are not unique. To make them unique, call `.var_names_make_unique`.
  utils.warn_names_duplicates("var")
AnnData object with n_obs × n_vars = 3798 × 36601
    obs: 'in_tissue', 'array_row', 'array_col'
    var: 'gene_ids', 'feature_types', 'genome'
    uns: 'spatial'
    obsm: 'spatial'
Train the model
Available: ‘Xenium’, ‘Visium’, ‘Stereo’, ‘Slide’.
It is essential to specify the type of ST data, as different ST technologies require distinct preprocessing steps. Additionally, you have the option to select between mini-batch training for large datasets and full dataset training for smaller ones, ensuring efficient data processing and model performance.
dtype = "Visium"
config=Config(device=device,dtype=dtype, use_mini_batch=False)
from semanticst.SemanticST_main import Semantic as Trainer
config_used = copy.copy(config)
model = Trainer(adata,config)
adata=model.train()  # Train the model
🚀 Welcome to SemanticST! 🚀

📢 Recommendation: If your dataset contains more than 40000 spots or cells, we suggest using **mini-batch training** for efficiency.

✅ Using Full Dataset Training (No Mini-Batching). 🔥
/home/roxana/anaconda3/envs/semanticst3/lib/python3.9/site-packages/numba/np/ufunc/parallel.py:371: NumbaWarning: The TBB threading layer requires TBB version 2021 update 6 or later i.e., TBB_INTERFACE_VERSION >= 12060. Found TBB_INTERFACE_VERSION = 12050. The TBB threading layer is disabled.
  warnings.warn(problem)
Begin to train ST data...
Learning Semantic graphs: 100%|████████████████████████████████████████████████████████████████████████████████████████████████████████████████████████████████████████| 250/250 [00:11<00:00, 21.78epoch/s]
Semantic Graph Learning Completed
Feature Learning Epochs: 100%|██████████████████████████████████████████████████████████████████████████████████████████████████████████████████████████████████████████| 1000/1000 [05:27<00:00, 3.05it/s]
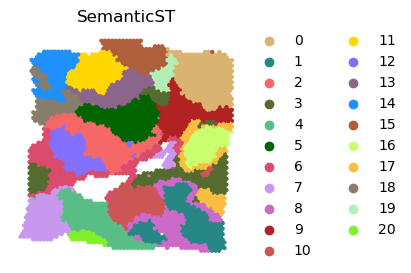
Clustering
- Louvain
from sklearn.decomposition import PCA
pca = PCA(n_components=40, random_state=1)
embedding = pca.fit_transform(adata.obsm['emb_decoder'].copy())
adata.obsm['emb_pca'] = embedding
sc.pp.neighbors(adata, use_rep='emb_pca')
sc.tl.umap(adata)
sc.tl.louvain(adata, resolution=1.3)
adata.obsm['spatial'][:, 1] = -1*adata.obsm['spatial'][:, 1]
adata.uns['louvain_colors'] =  ["#DAB370","#268785","#F56867","#556B2F","#59BE86","#006400","#DB4C6C","#C798EE",
            "#CD69C9","#B22222","#CD5555","#FFD700","#8470FF",
           "#8B658B","#1E90FF","#AF5F3C","#CAFF70", "#F9BD3F",
           "#877F6C",  '#B4EEB4','#82EF2D',"#EE7621"]
plt.rcParams["figure.figsize"] = (3, 3)
fig, ax = plt.subplots()
sc.pl.embedding(adata, basis="spatial", color="louvain",s=40,palette=adata.uns['louvain_colors'], ax=ax,show=False, title='SemanticST')
plt.axis('off')
plt.show()
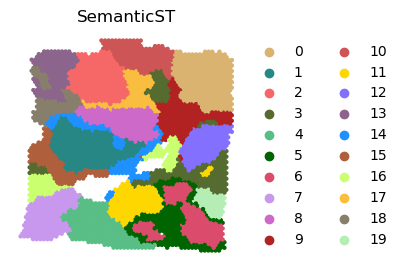
sc.tl.leiden(adata, resolution=0.8)
adata.uns['louvain_colors'] =  ["#DAB370","#268785","#F56867","#556B2F","#59BE86","#006400","#DB4C6C","#C798EE",
            "#CD69C9","#B22222","#CD5555","#FFD700","#8470FF",
           "#8B658B","#1E90FF","#AF5F3C","#CAFF70", "#F9BD3F",
           "#877F6C",  '#B4EEB4','#82EF2D',"#EE7621"]
plt.rcParams["figure.figsize"] = (3, 3)
fig, ax = plt.subplots()
sc.pl.embedding(adata, basis="spatial", color="leiden",s=40,palette=adata.uns['louvain_colors'], ax=ax,show=False, title='SemanticST')
plt.axis('off')
plt.show()
/tmp/ipykernel_775747/4087953313.py:1: FutureWarning: In the future, the default backend for leiden will be igraph instead of leidenalg.

 To achieve the future defaults please pass: flavor="igraph" and n_iterations=2.  directed must also be False to work with igraph's implementation.
  sc.tl.leiden(adata, resolution=0.8)
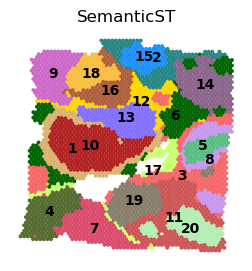
4. Clustering
- mclustn_cluster =20
tool='mclust'
from semanticst.utils import clustering
clustering(adata,seed=41, n_clusters=n_cluster, method=tool,key='emb_decoder')
Unable to determine R library path: Command '('/usr/lib/R/bin/Rscript', '-e', 'cat(Sys.getenv("LD_LIBRARY_PATH"))')' returned non-zero exit status 1.
R[write to console]:                    __           __
   ____ ___  _____/ /_  _______/ /_
  / __ `__ \/ ___/ / / / / ___/ __/
 / / / / / / /__/ / /_/ (__  ) /_
/_/ /_/ /_/\___/_/\__,_/____/\__/   version 6.0.0
Type 'citation("mclust")' for citing this R package in publications.
fitting ...
  |======================================================================| 100%
import matplotlib.pyplot as plt

plt.rcParams["figure.figsize"] = (3,3)
sc.pl.embedding(adata, basis="spatial", color="domain",palette=adata.uns['louvain_colors'], show=False,legend_loc='on data', title='SemanticST')
plt.axis('off')
#plt.savefig("breast_cancer_SemanticST_louvain_20_v2.png", dpi=600,bbox_inches='tight')
plt.show()